Level Map Survey Data
To access this screen:
-
The Survey panel is part of the Mapping task bar. It only appears if a level map is selected.
Once an empty level map has been created, you can load survey data to use as a basis for back mapping. This panel is not displayed if the current map is a face map.
This data can take the form of points or strings, and can be in any of the hundreds of formats supported by Datamine Studio applications.
Note: all level maps are generated and updated using world coordinates. Feature data is digitized directly onto survey data. No georeferencing is applied.
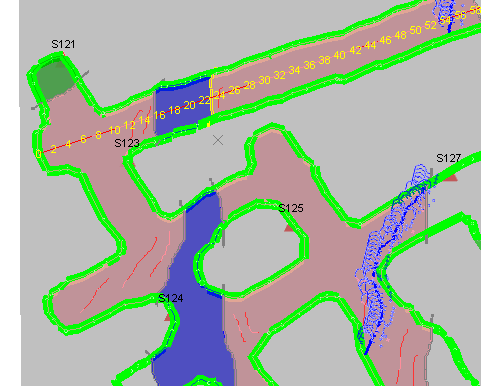
A level map showing cumulative back mapping and tape line
The Survey panel displays automatically if a level map is created via the Add Map screen.
One or more reference data files can be loaded, and each file can be in any supported format. Once loaded, the remainder of the Mapping task bar can be used to add field data, including features, comments, sketches and so on.
This screen is also used to project your digitized level map elements in an appropriate way, ready for reporting. This applies to any 'string' or 'point' map data, including features, strings and comments.
Survey Data Appearance
Imported survey data is displayed according to the templates specified in your system configuration file.
The formatting information is stored in a 3D display template and automatically applied when the project loads (templates are set per project, not per database).
As with all visual mapping data types, a template can be specified for both the 3D window visualization and the template used to prepare a report (a plot template).
Typically, this formatting specification is prepared by your system implementer.
To import survey data for level mapping reference:
-
Create a Level map. See Create a Level Map.
The Survey screen displays.
-
Click either Browse for Strings or Browse for Points, depending on the type of survey data you are importing.
-
Use the Data Import screen to pick a Driver Category and Data Type.
-
Click OK to display the screen(s) appropriate for the selected driver category and type.
Tip: click Driver Help for more information on a particular data source driver.
-
Pick the file to import and click Load.
-
Once import has completed, the level map and reference data are displayed.
Note: the level map section appears at the Reference Z elevation specified on the New Map screen. If there is a large disparity between this elevation and the average level value of the imported data, data may not be rendered as expected due to an exceedingly large 3D 'scene'.
-
Continue to add all survey data files. Each file appears as a list item.
-
For each loaded reference file:
-
Click into the Filter cell to display the Expression Builder. This lets you filter the view of reference data with reference to any data or explicit value. For example, you can restrict your loaded reference development outlines to show only those relevant to your current map level. See Expression Builder.
-
Check the Status of your reference data. This is particularly important if you are sharing data with others, either via a shared database, or the MineTrust facility.
-
 You are using the latest available version of survey data.
 -
 There could be a problem as your survey data isn't the latest version available. It is recommended that you reload your data before you continue.
-
-
-
Optional filter one or more survey files by clicking into the Filter cell of the table to display the Expression Builder. This allows you to filter data to show a particular data with a particular attribute value, or data within a range, or other types of constraints. See Expression Builder.
-
With reference data loaded, use the Mapping Task Bar to add field data.
-
Save your project.
Note: delete survey data files using the delete button in the appropriate table row.
To project (drape) your field data to a reference level:
Note: the settings displayed below can be constrained using your system configuration file. Not all options may be available.
-
Display the Survey screen.
-
Import survey data. See above.
-
Digitize features and other map elements as needed. See The Mapping Task Bar.
-
Redisplay the Survey screen.
-
Choose a draping option:
-
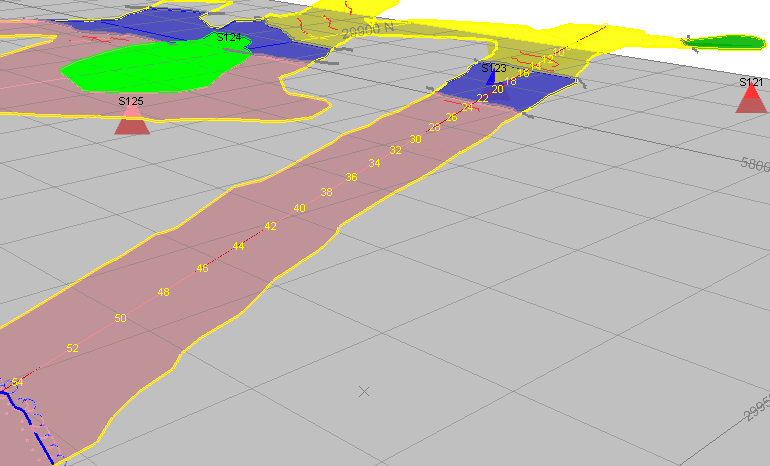
Drape Mapping to Survey—project all digitized map data (ignoring survey data) to a level represented by the survey data. This can be really useful where the mapped back is dipping or varies off the reference level at points, as your digitized field data projects to a level that matches the implied surface, not the flat section.
For example, in the image below, survey strings (yellow) have been enhanced with filled areas representing lithological zones, plus a tape line showing distance from a survey station:
-
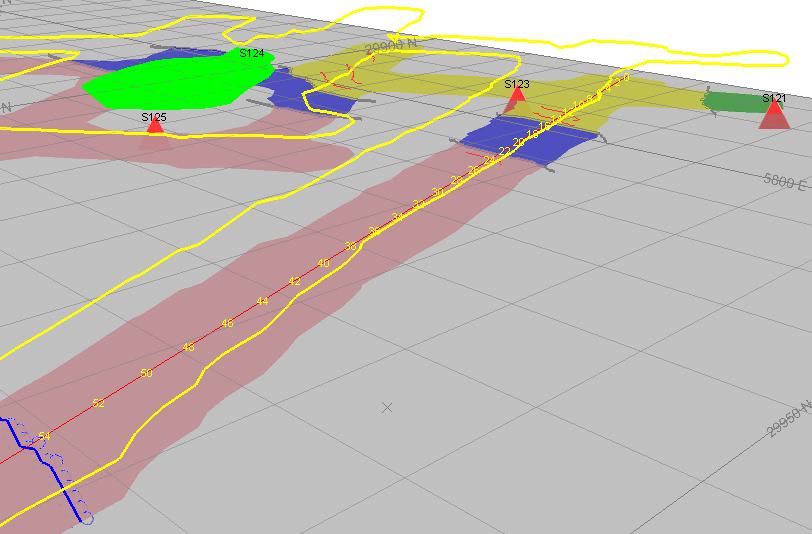
Drape Mapping to Section—this option projects field data to the map section, meaning all field data ends up at the same level. This may or may not be coincident with the coordinates of the survey data (in fact, it is unlikely to unless the survey data is precisely on-section).
Compare the image below, which projects the same data as the image above using the section option:
Both images are not in plan view, and if viewed orthogonally (with perspective mode disabled), both maps would appear to be identical.
-
-
Save your project.
-
Generate a PDF report.
Related topics and activities


